
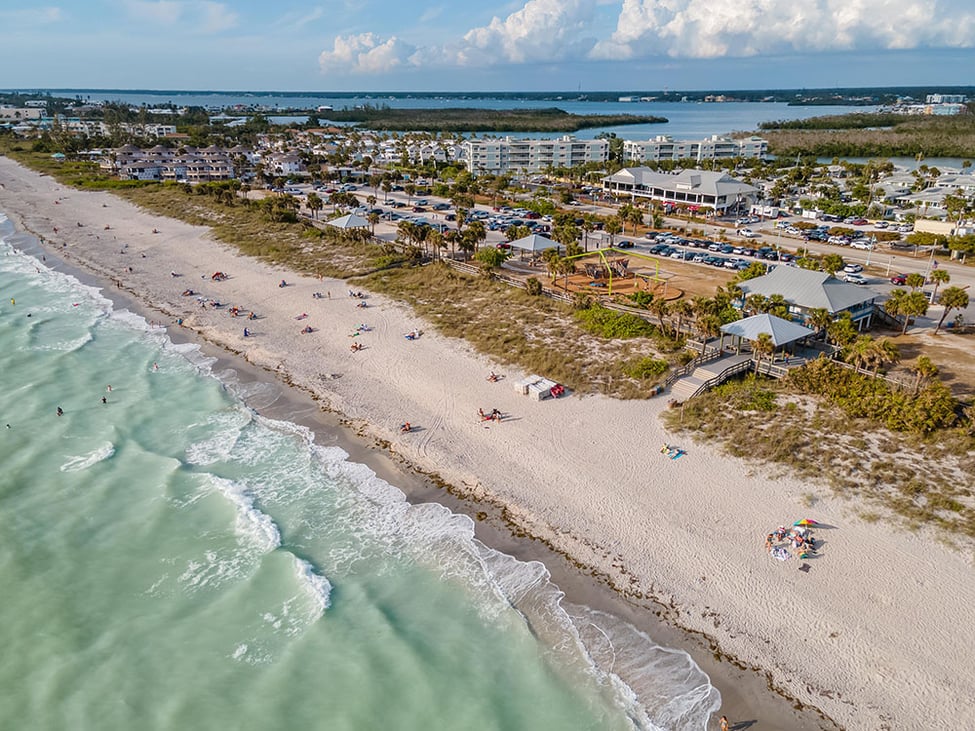
Englewood Area - 2023 - A Year in Review

Here's a look at the Englewood Area market for the entire 2023 year:

Month                 Active Listings      Pendings      Solds    Avg Sales Price     Avg Days on Mkt

Jan                              687                       234                 138          $454,377                          33

Feb                             750                       254                 171          $390,624                          33

Mar                            892                        273                244          $507,182                          36

Apr                             966                        239                266          $537,488                          32

May                           1,055                      238                285         $514,648                           32

June                           987                         176                219         $466,621                           31

July                            1,071                      203                216         $489,648                           56

Aug                            1,130                      167               200          $465,147                           56

Sept                           1,267                      162               202          $501,171                           72

Oct                            1,395                       162               215          $483,849                           40

Nov                           1,570                       236               169         $472,303                            53

Dec                             968                         119               163         $480,339                            52

Jan 03, 2024